
Blog
Win Rate vs Profit Factor: What to Track in 2026
Win rate vs profit factor: why 70% can still lose. Formulas, two 100-trade examples, and how a journal should show both. Start free, no card.
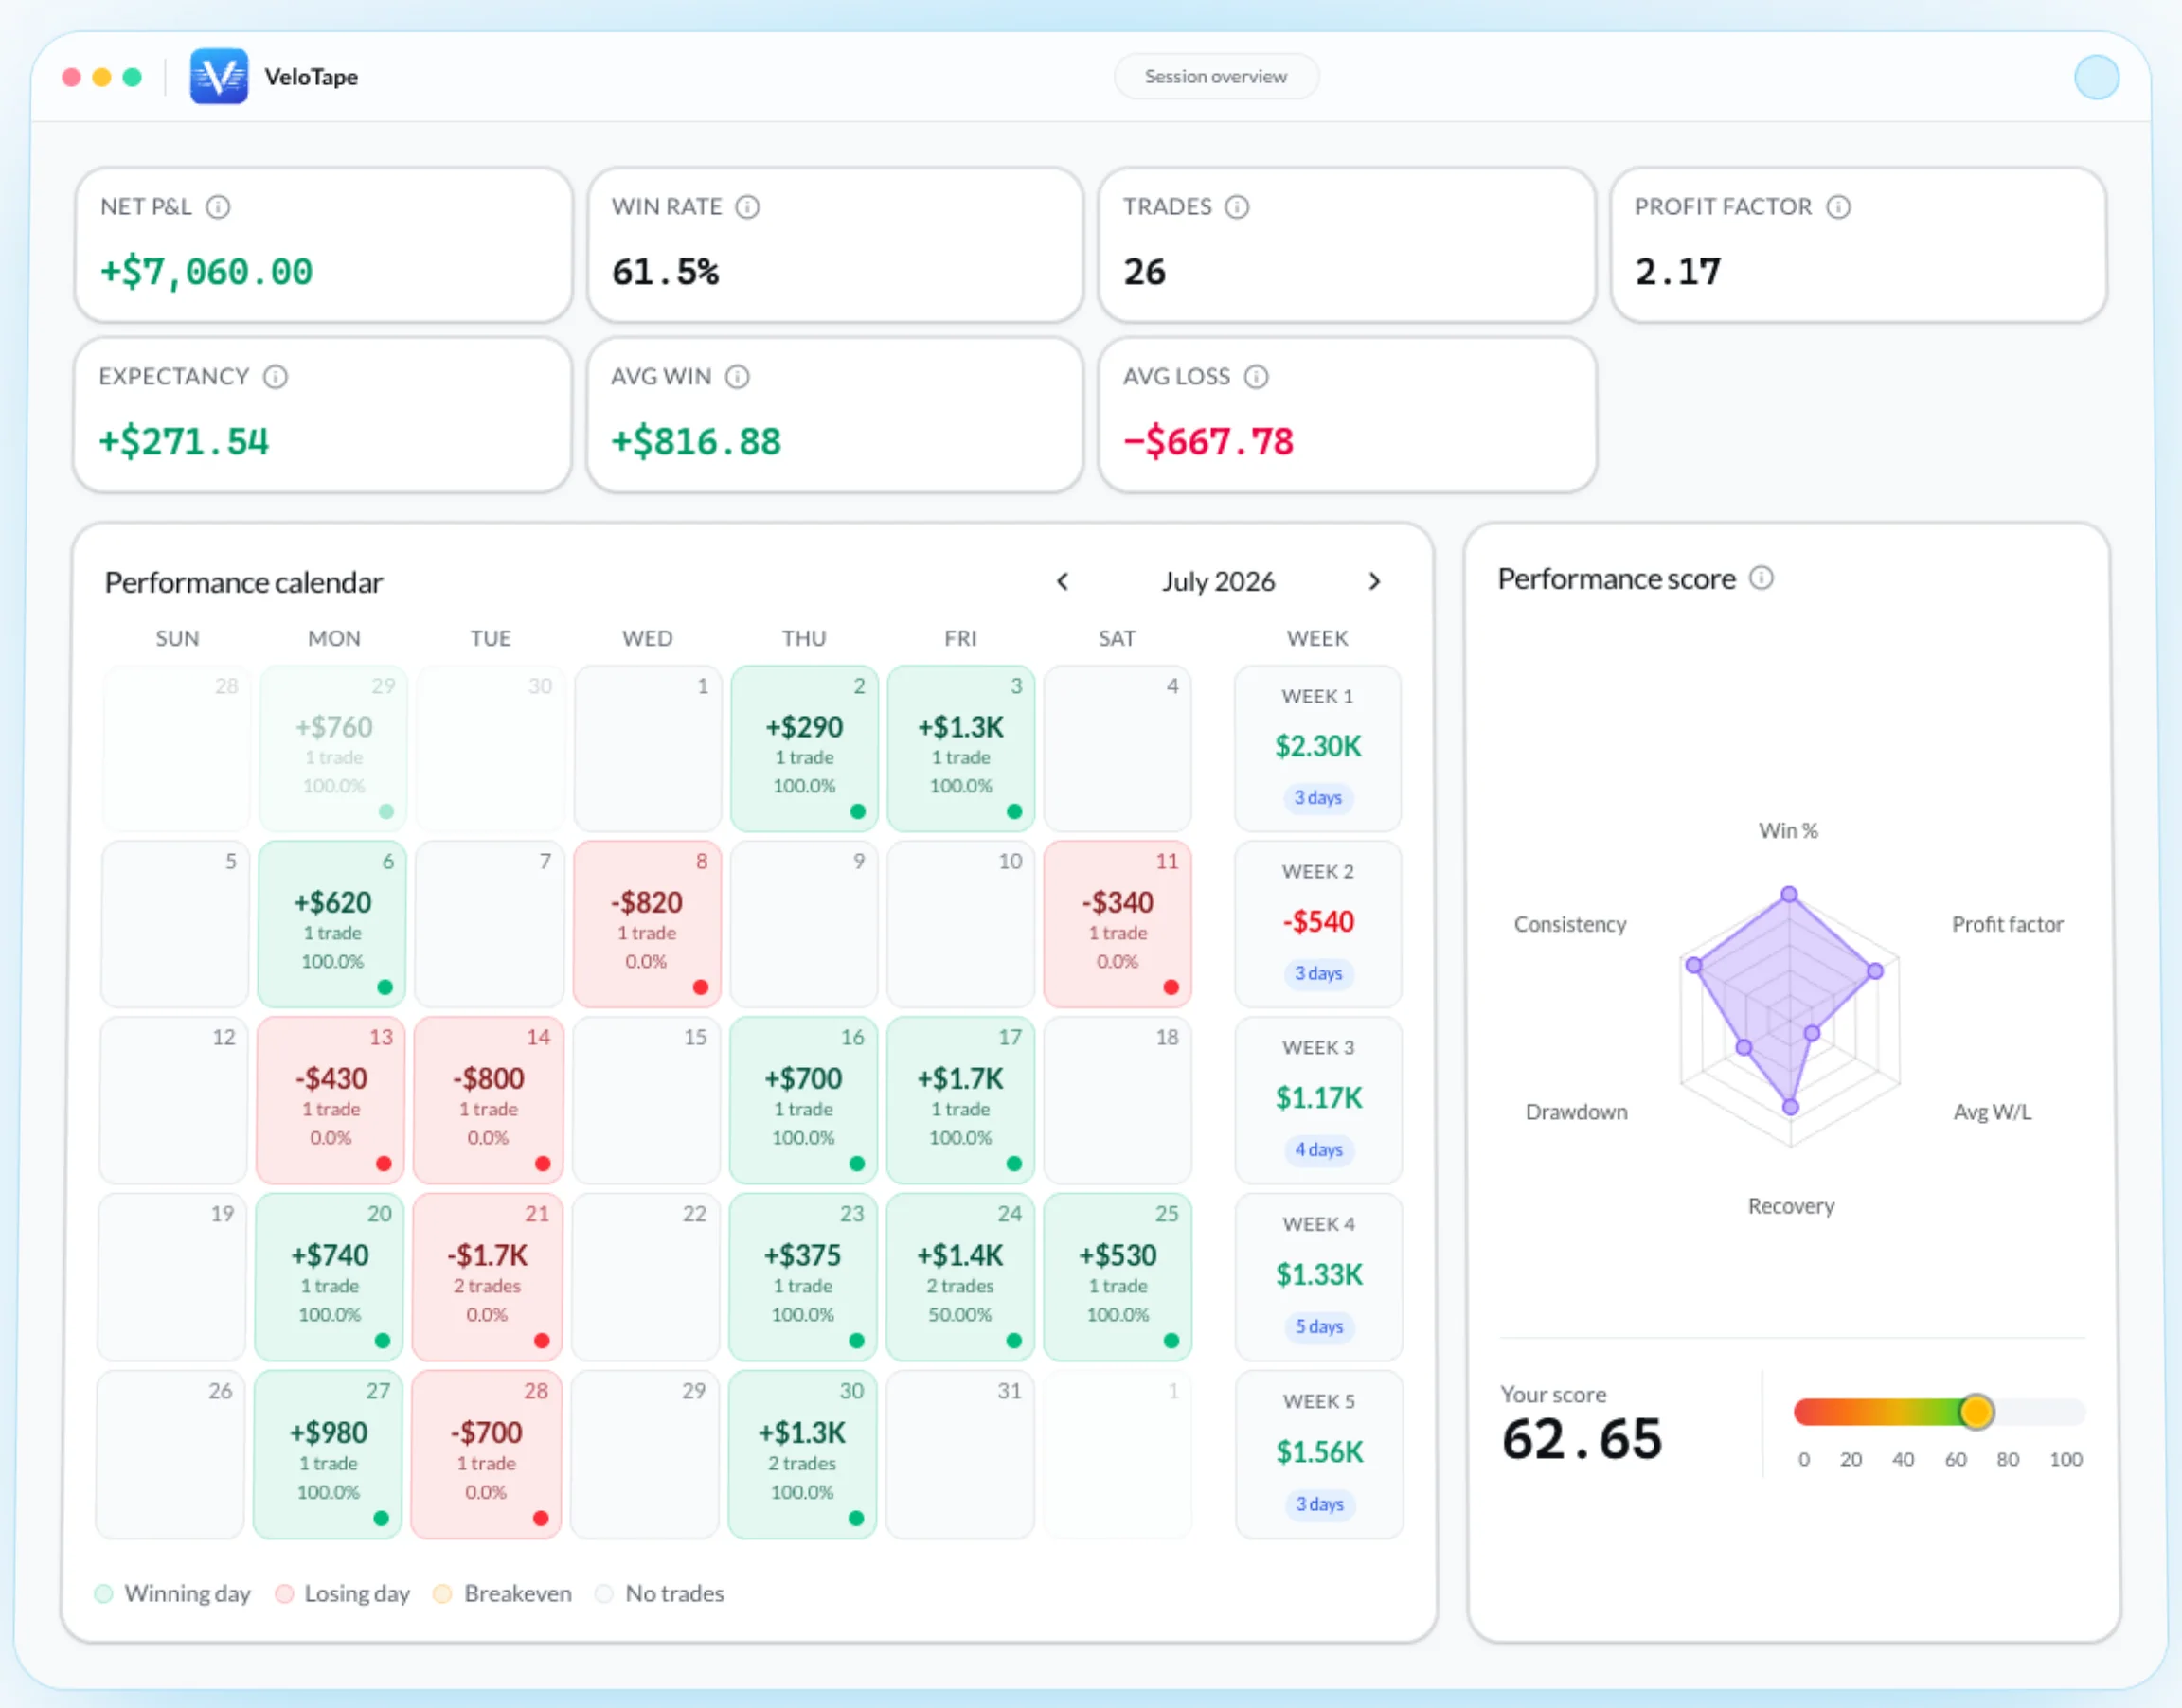
Screenshots show the VeloTape product interface (sample data for illustration).
Win rate vs profit factor is the comparison traders search after a green week that still felt wrong — or a red week that followed the plan. Win rate answers how often you were right. Profit factor answers whether the winners paid for the losers. A journal that shows one without the other is how people optimize for being right and slowly donate the account.
This is not a tour of every metric. For the five-number stack (including drawdown and time-of-day), use trading journal metrics to track. This page is the head-to-head: formulas, two 100-trade books, when win rate still matters, and what to verify in the journal after import.
Win rate vs profit factor — the short answer
Profit factor is the better profitability check. Win rate is a style label. You need both on the same closed-trade sample, plus expectancy (average dollars per trade) so the ratio has a unit.
Question it answers
- Win rate alone
- How often was I right?
- Profit factor (with win rate)Use this to decide
- Did dollars won beat dollars lost?
Easy to game
- Win rate alone
- Cut winners early, “be right”
- Profit factor (with win rate)Use this to decide
- Tiny scalps shrink the ratio
Style / psychology
- Win rate alone
- Shows how often you sit through red
- Profit factor (with win rate)Use this to decide
- Silent on streak frequency
Fees and scratches
- Win rate alone
- Scratches lower the %
- Profit factor (with win rate)Use this to decide
- Uses net P&L when imports are net
Best weekly use
- Win rate alone
- Split by setup and session
- Profit factor (with win rate)Use this to decide
- Judge if the book still pays
| Factor | Win rate alone | Profit factor (with win rate)Use this to decide |
|---|---|---|
| Question it answers | How often was I right? | Did dollars won beat dollars lost? |
| Easy to game | Cut winners early, “be right” | Tiny scalps shrink the ratio |
| Style / psychology | Shows how often you sit through red | Silent on streak frequency |
| Fees and scratches | Scratches lower the % | Uses net P&L when imports are net |
| Best weekly use | Split by setup and session | Judge if the book still pays |
Last verified: 2026-09-14. Win rate answers how often you were right. Profit factor answers whether winners paid for losers. A journal should show both — plus expectancy — on the same closed-trade sample.
If you only remember one sentence: a 40% book with a 2.0 profit factor can beat a 70% book that cuts every winner. The rest of this article is the math, the traps, and the weekly review that keeps you from gaming the percentage.
What win rate actually measures
Win rate is the share of closed trades that finished with a profit.
Win rate = winning trades ÷ closed trades
Example: 40 wins, 60 losses → 40%.
It does not measure:
- How large the wins were
- How large the losses were
- Whether fees flipped a scratch into a loss
- Whether the next trade will win
That is why a blended 62% on the dashboard can hide a setup that wins 80% of $40 scalps and another that loses 2R all afternoon. Split win rate by setup tag and session before you quote it.
Scratches count (in the denominator)
A net-zero close is not a win. In VeloTape, win rate is winners ÷ all closed trades with a P&L. Twelve scratches on 100 closes drop a 48-win book from a vanity 54.5% (48 ÷ 88) to 48%. That is honest. Inflating the rate by dropping scratches is how journals start lying.
Open trades do not belong in the percentage. The journal should wait until the fill is closed.
What profit factor actually measures
Profit factor is gross profit divided by gross loss (absolute value), on the same closed sample.
Profit factor = gross profit ÷ |gross loss|
Example: $11,200 of winning trades and $5,400 of losing trades → 11,200 ÷ 5,400 ≈ 2.07. You made about $2.07 for every $1 you lost.
| Profit factor (after the costs in your log) | How to read it |
|---|---|
| Below 1.0 | The sample lost. Size, setup, or rules — not a new indicator. |
| 1.0–1.2 | Fragile. One ugly week or honest slippage can flip it. |
| 1.2–1.5 | A thin edge. Worth watching by setup, not celebrating. |
| 1.5–2.5 | Workable on live data if the sample is not twelve trades. |
| Above ~3 on a tiny sample | Suspect luck or a missing loser, not a personality trait. |
These bands are heuristics, not pass/fail scores. Futures with large commission drag and a once-a-week swing book will not share a “good” number. Compare your profit factor this month to your profit factor last month, on the same tags.
VeloTape uses net P&L from closed fills (imports store P&L after fees when the broker file includes them). If the CSV omitted commissions, the ratio is gross — same warning as any Orders export.
If you have winners and zero losers, the ratio is not a trophy. It is an unfinished sample.
Two traders, 100 trades, same “effort”
Same trade count. Opposite stories. Numbers are rounded for the page — your journal will not be this clean.
| Trader A — “I am right” | Trader B — “I get paid” | |
|---|---|---|
| Win rate | 70% (70 wins / 30 losses) | 40% (40 / 60) |
| Average win | $80 | $280 |
| Average loss | $220 | $90 |
| Gross profit | $5,600 | $11,200 |
| Gross loss | $6,600 | $5,400 |
| Profit factor | 0.85 | 2.07 |
| Net P&L | −$1,000 | +$5,800 |
| Expectancy | −$10 / trade | +$58 / trade |
Trader A cut winners to protect the streak. Trader B took more red closes and let the A+ trades finish. If your journal only prints win rate, A looks like the professional.
Run the same table on one setup at a time. A blended 1.8 profit factor can be one playbook at 2.4 and another at 0.7. Killing the 0.7 tag does more than “trying to win more often.”
They are the same math, viewed twice
On a sample with no scratches, profit factor and win rate are linked through average win and average loss:
Profit factor = (win rate × average win) ÷ ((1 − win rate) × average loss)
Rearranged, the win rate you need to break even at a given payoff R (average win ÷ average loss) is:
Breakeven win rate ≈ 1 ÷ (1 + R)
If average win is 2× average loss (R = 2), you need about 33% winners to break even before the next fee. If R = 0.5 (winners half the size of losers), you need about 67%. That is the whole “70% can still lose” story in one line.
Expectancy is the dollar view of the same identity:
Expectancy = (win rate × average win) − (loss rate × average loss)
VeloTape also reports expectancy as net P&L ÷ closed trades, which matches that formula when scratches are in the sample (they pull the average toward zero). For a deeper stack with drawdown and session buckets, stay on the metrics guide.
Investopedia’s myth of profit/loss ratios is a clean non-vendor page on why payoff without win probability (expectancy) misleads.
When win rate still matters
Profit factor is the judge. Win rate is still useful — just not as a scoreboard.
- Psychology. A 35% trend book can be the correct math and the wrong temperament. If you cannot sit through six losers, you will override the plan and destroy the ratio you were proud of.
- Costs. High-frequency scalps need a high win rate or the round-trip fee eats expectancy. Check profit factor after commissions, not on mark-to-market ticks.
- Diagnosis. Win rate by setup and session shows where you are actually right. Midday 72% on noise that pays $12 is not the same as the open.
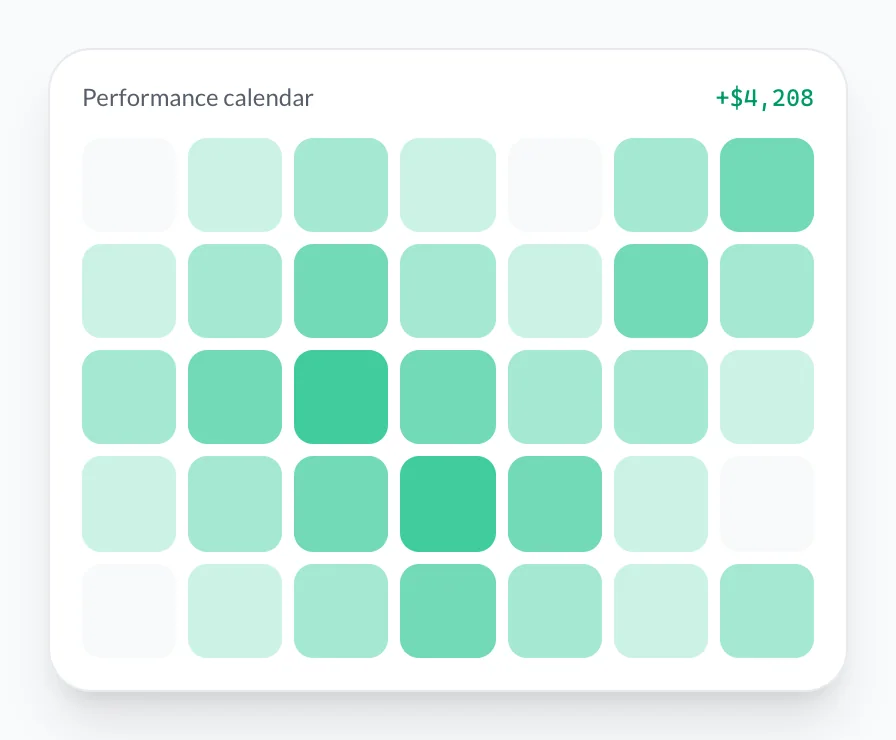
- Streaks. Profit factor is silent on how often red closes cluster. Pair it with the performance calendar so a 2.0 book that dumps every Friday is visible.
Do not raise win rate as a goal. Raise plan adherence and let the percentage land where the payoff lives.
What a trading journal should show (not a spreadsheet tab)
A dedicated journal earns its keep when both numbers update from the same fills — no copied formulas, no “I forgot Tuesday.”
| Check | Why it matters for win rate vs profit factor |
|---|---|
| Closed trades only | Open P&L is not a win. |
| Net of fees when the source has them | A 1.15 ratio can be 0.95 after commissions. |
| Win rate + profit factor + avg win/loss + expectancy on one dashboard | Stops the “I was right” story. |
| Filters by tag, symbol, date, session | Blended stats hide the leak. |
| Scratches visible | They dilute win rate; they should not vanish. |
VeloTape puts win rate, profit factor, expectancy, average win, and average loss on the dashboard from closed trades. Setup and symbol breakdowns add win rate and net P&L so you can see which tag paid. Import or sync first — IBKR, Tradovate/Apex, or CSV — then tag; the math is only as honest as the log. See what to record in a trading journal if the execution layer is still incomplete.
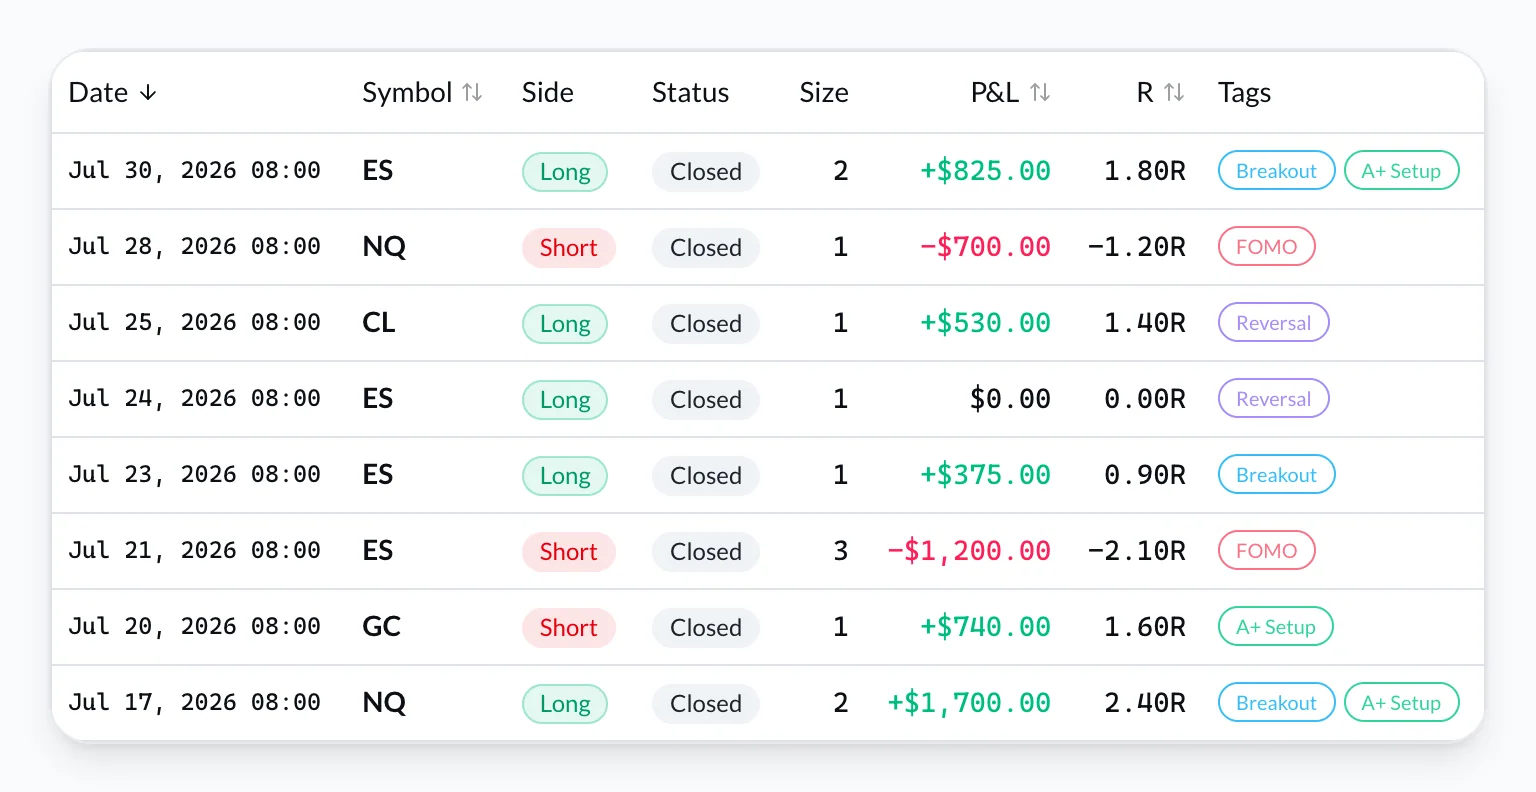
Create a free VeloTape account — CSV and the dashboard metrics run on Free; no credit card.
Sample size: when to ignore both numbers
- Under ~30 closed trades: directional doodles. Do not kill a setup.
- Per playbook: wait for a larger pile (often 50–100) before you archive it.
- After a rule change: start a new mental sample. Old profit factor describes old behavior.
- One outlier: a +8R lottery fill can print a 3.0 profit factor that disappears next month. Peek at largest win next to the ratio.
Journals do not create statistical proof. They reduce the chance you remember only the Tuesday winner. Paper or sim books get a discount: fills, fees, and emotion differ. Do not promote a demo 2.4 profit factor to live size.
Weekly review: use both numbers in 20 minutes
Same cadence as a day trading journal daily review, with a metrics lens:
- Account profit factor this week vs last month (same tags, same costs).
- Win rate by setup — not the blended tile. Which tag is the 70% loser?
- Average win vs average loss — did you cut A+ trades to protect the streak?
- Expectancy — if it is negative on 40+ trades, the story in the notebook is wrong.
- One behavior to change. Not a new system. Not a new firm.
If the journal says you traded well and profit factor fell, trust the ratio. Notes explain why; they do not outvote dollars.
Common traps
| Symptom | What is usually going on | Fix |
|---|---|---|
| Win rate up, P&L down | Cutting winners, letting losers breathe | Pair WR with avg win/loss every review |
| Profit factor 4.0 on 18 trades | One outlier or a missing week | Wait; check largest win |
| 90% on scratches-as-wins | Denominator games | Count net-zero as closed, not wins |
| Blended PF looks fine | One dead setup funded by another | Filter by tag |
| Demo PF copied to live | Different fees and behavior | Separate accounts; smaller size |
FAQ: win rate vs profit factor
Should I optimize for a higher win rate?
No. Optimize for following the written plan and a stable payoff. Win rate is an outcome. Chasing it produces exactly the 70% / 0.85 book above.
Is profit factor better than expectancy?
They agree on a clean sample. Profit factor is a compact “does this pay?” ratio. Expectancy is dollars (or R) per trade — better for comparing a 200-trade scalp book to a 40-trade swing book. Show both.
Do prop firm traders need a high win rate?
They need to stay inside closed-trade daily loss and trailing rules while the firm dashboard handles live risk. A high win rate that still prints a 0.9 profit factor will fail an eval on the days the 2R loser lands. Journal the rules; do not confuse them with a live liquidation engine. See prop firm trading journal.
Futures, options, and leveraged products involve substantial risk of loss — see the CFTC Learn & Protect hub. A journal improves review. It does not guarantee profit or a funded account.
Track win rate and profit factor on a free journal — import your history, open the dashboard, and run this week’s review on both numbers.
More guides

5 Trading Journal Metrics Every Trader Should Track
Win rate, profit factor, expectancy, max drawdown, and time-of-day performance — what each metric means, the formulas, and how to read them in your journal.

Trading Journal FAQ: 21 Questions Answered (2026)
Clear answers to 21 trading journal FAQ traders ask most: what to record, Excel vs apps, profit factor, reviews, and a free way to start. No credit card.

Day Trading Journal: Build a Daily Review Habit
Build a day trading journal that survives busy sessions — a 10-minute daily review habit, batch logging for scalps, and a close checklist you can run every day.
Trading involves substantial risk. VeloTape is for journaling and analytics only — not investment advice.