
Blog
5 Trading Journal Metrics Every Trader Should Track
Win rate, profit factor, expectancy, max drawdown, and time-of-day performance — what each metric means, the formulas, and how to read them in your journal.
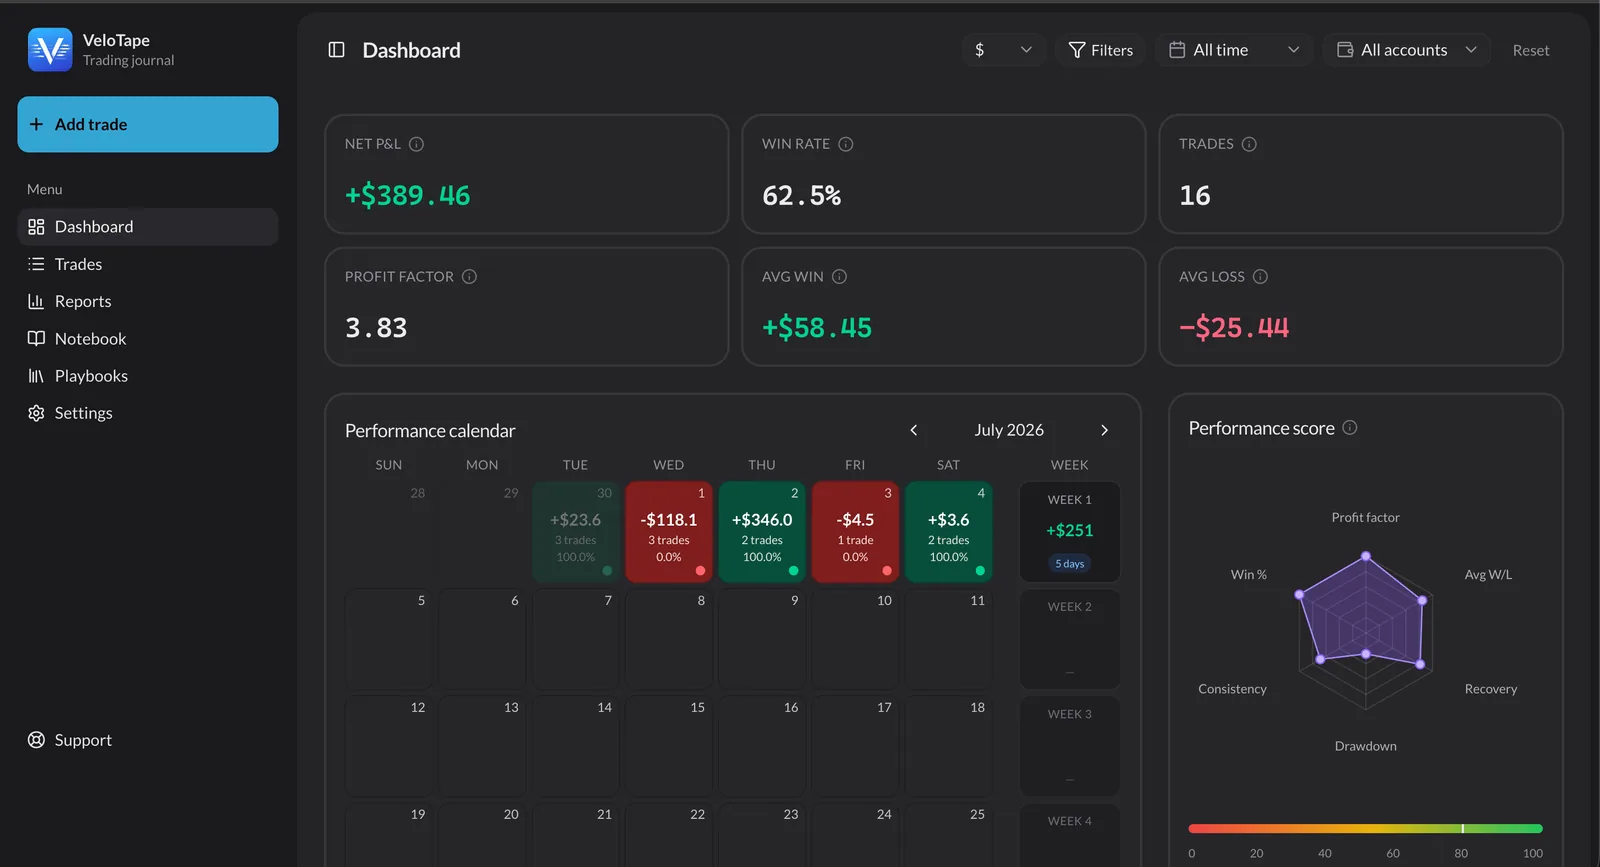
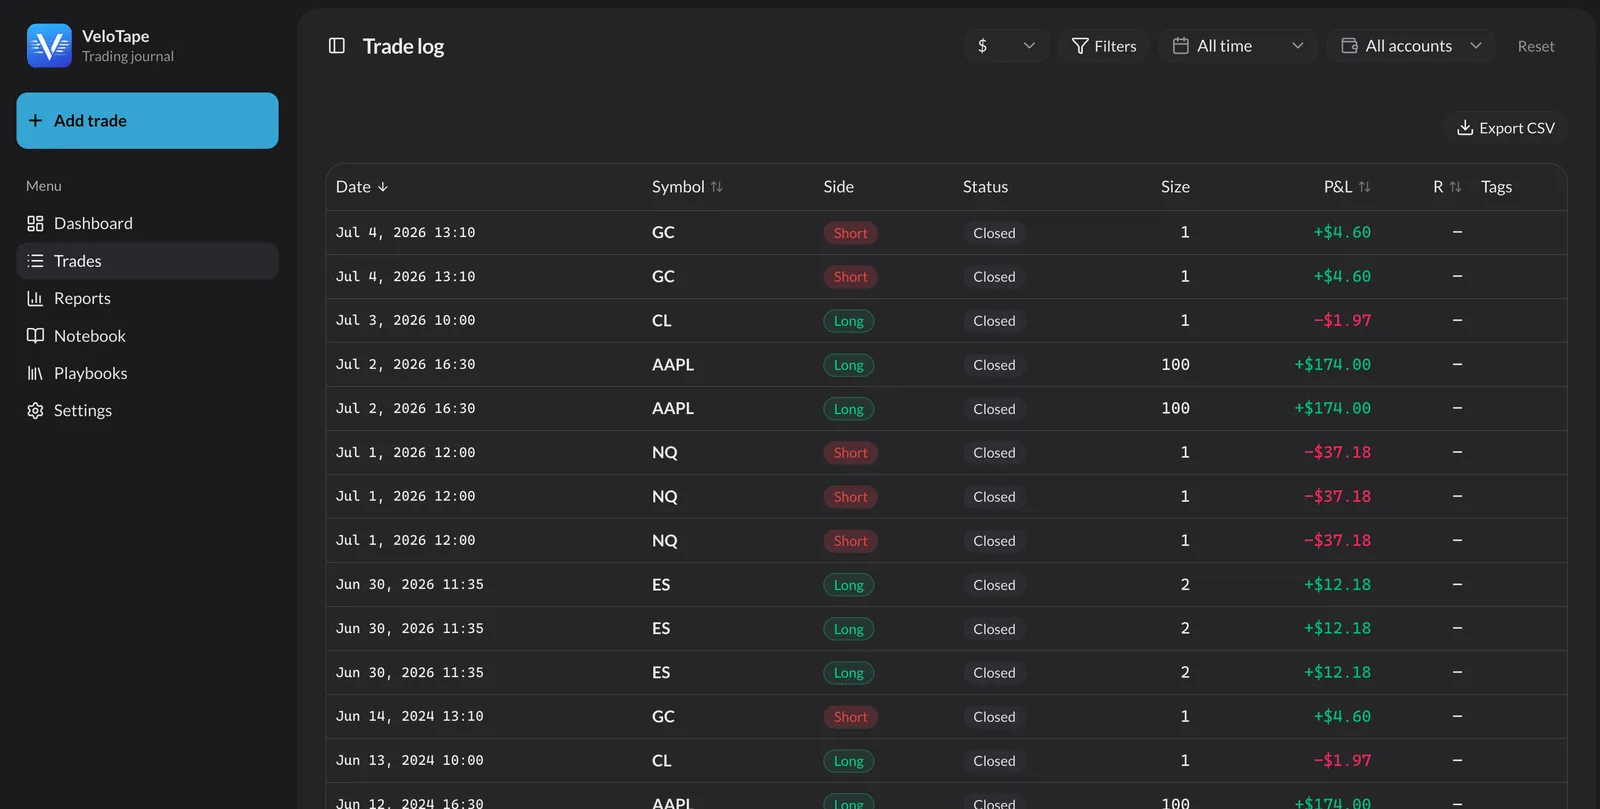
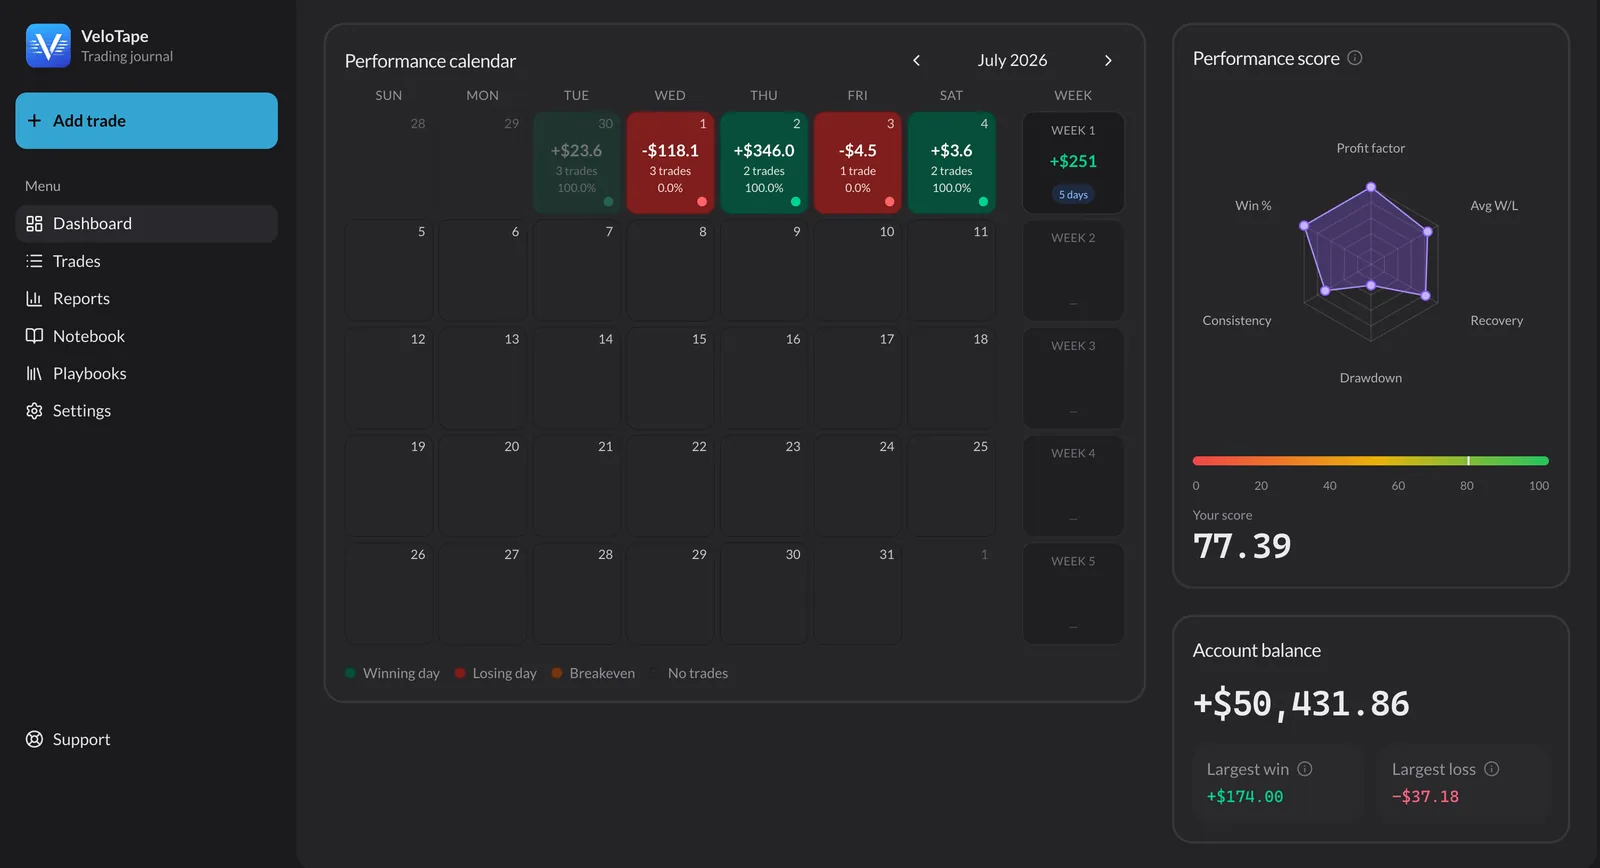
Screenshots show the VeloTape product interface (sample data for illustration).
You can log every fill and still learn nothing if you watch the wrong numbers. Trading journal metrics turn raw trades into decisions: which setup to keep, when to stop trading, and whether your edge is real or a lucky streak.
This guide covers the five metrics every trader should track in a journal — win rate, profit factor, expectancy, max drawdown, and time-of-day performance — with plain formulas and how to read them without fooling yourself.
New to journaling? Start with our free trading journal guide and how to keep a trading journal — then use this page to know what to watch in your stats.
Why these five metrics (and not fifty)
Most platforms offer dozens of reports. You do not need all of them on day one. These five answer the questions that actually change behavior:
| Metric | Answers |
|---|---|
| Win rate | How often am I right? (by setup, not vanity) |
| Profit factor | Do winners outweigh losers in dollar terms? |
| Expectancy | What do I earn per trade on average? |
| Max drawdown | How bad can a bad streak get? |
| Time-of-day | When should I be in the market at all? |
Everything else — Sharpe ratio, R-multiples, MAE/MFE — builds on this foundation. Master the five first.
1. Win rate — useful, easy to misuse
Win rate is the percentage of trades that close profitable.
Formula
Win rate = (Number of winning trades ÷ Total closed trades) × 100
Example: 10 wins and 6 losses → 10 ÷ 16 = 62.5%.
How to read it in your journal
- Never trust one global win rate for all strategies. Break out by setup tag, symbol, and session.
- A 70% win rate on a setup that pays $50 and loses $200 is worse than 40% on a setup with 3R targets.
- Compare win rate before and after rule changes — not to Twitter gurus.
VeloTape shows win rate on the dashboard and in reports filtered by tag, symbol, and date range.
Common mistake
Optimizing for win rate alone. Traders cut winners early to "be right" and let losers run. Your journal should pair win rate with average win vs average loss (see profit factor below).
2. Profit factor — the headline health check
Profit factor compares gross profits to gross losses. It is the fastest way to ask: Does this system make money?
Formula
Profit factor = Gross profit ÷ |Gross loss|
Example: $7,700 gross profit and $2,010 gross loss → 7,700 ÷ 2,010 ≈ 3.83.
Use absolute value for losses. A profit factor of 1.0 is breakeven before fees. Many discretionary traders aim for 1.5+ on live data; prop firm traders often want higher buffers.
How to read it
- Below 1.0 — system loses over the sample; fix size, setup, or rules before adding trades.
- 1.0–1.5 — fragile edge; one bad week can flip you red.
- Above 1.5 — worth digging into which setups drive the number.
Track profit factor by month and by setup. One heroic week can inflate a thin edge.
3. Expectancy — average dollars per trade
Expectancy (sometimes called expected value per trade) tells you what each trade is worth over time.
Formula
Expectancy = (Win rate × Average win) − (Loss rate × Average loss)
Example: 62.5% win rate, $58.45 average win, $25.44 average loss:
(0.625 × 58.45) − (0.375 × 25.44) ≈ 36.5 − 9.5 ≈ $27 per trade
Positive expectancy with enough sample size supports scaling size slowly. Negative expectancy means stop tweaking indicators and fix the process.
How to read it
- Requires enough trades — do not trust expectancy on 8 fills.
- Combine with profit factor: both should agree over 30+ trades.
- Recompute after changing one rule and run another 20 sessions before judging.
VeloTape derives average win, average loss, and net P&L from the same imported history — no spreadsheet formulas to maintain.
4. Max drawdown — respect the red streak
Max drawdown is the largest peak-to-trough decline in your equity curve over a period.
Formula (conceptual)
Max drawdown = Largest (Peak equity − Subsequent trough) in the period
Example: equity peaks at $50,500, drops to $50,389 before recovering → drawdown ≈ $111 (0.2% in the sample below).
How to read it
- Compare drawdown to daily loss limits (especially prop firm rules).
- If max drawdown spikes after you increase size, your risk is misaligned.
- Pair with the performance calendar — drawdown often clusters on specific weekdays or after rule breaks.
Prop firm and challenge traders should track drawdown daily and cumulative — not just monthly P&L.
5. Time-of-day performance — when to trade (and when to stop)
Not every hour pays you equally. Time-of-day analysis splits P&L, win rate, or profit factor by session bucket — open, midday, close, or custom windows.
What to track
- Net P&L by hour or session — are you funding the morning with afternoon losses?
- Win rate by session — a setup may work at the open and fail at lunch.
- Trade count by session — overtrading often shows up as negative expectancy in low-edge hours.
How to act on it
- Run the report for your last 30–60 sessions.
- Identify sessions with negative expectancy despite positive overall P&L.
- Add a simple rule: no new trades in red sessions until review.
- Re-check monthly — edges shift as volatility changes.
The calendar heatmap makes streaks obvious: green clusters, red weeks, and flat days you should have stayed flat.
How VeloTape calculates metrics automatically
Manual spreadsheets break when you skip a day or mis-type a fill. VeloTape recalculates from your trade log whenever data changes:
- Import or sync — IBKR, Tradovate, Apex, or CSV.
- Tag setups — win rate and profit factor split by strategy.
- Open dashboard — win rate, profit factor, net P&L, avg win/loss, trade count.
- Drill down — 50+ reports for session, symbol, side, and calendar views.
- Review weekly — same routine as our journal habit guide.
You focus on behavior; the journal keeps the math honest.
Metric cheat sheet (copy to your playbook)
Win rate        = Wins ÷ Total trades
Profit factor   = Gross profit ÷ |Gross loss|
Expectancy      = (Win% × Avg win) − (Loss% × Avg loss)
Max drawdown    = Max peak − trough on equity curve
Time-of-day     = P&L / win rate grouped by session or hour
Review all five monthly. Change one variable at a time.
Five mistakes when reading journal metrics
- Judging on too few trades — wait for 30+ closed trades per setup.
- One global win rate — always segment by tag and session.
- Ignoring profit factor — high win rate hides negative expectancy.
- Skipping drawdown — monthly P&L green while daily loss limits break.
- Never updating after rule changes — old metrics describe old behavior.
FAQ
What is the most important trading journal metric?
Profit factor and expectancy beat win rate alone. Use win rate to diagnose where you are right, not whether you are profitable.
What is a good win rate for day trading?
Context-dependent. Many profitable traders sit between 45% and 60% with solid reward-to-risk. Your journal’s setup-level win rate matters more than a headline number.
How do you calculate profit factor?
Gross profits divided by absolute gross losses. VeloTape computes it from imported fills automatically.
What is expectancy in trading?
Average expected P&L per trade from win rate and average win/loss sizes. Positive expectancy over enough trades supports your edge.
Why track max drawdown?
It measures worst-case pain and prop rule risk. It keeps position sizing honest after winning streaks.
Does VeloTape provide investment advice?
No. VeloTape is for journaling and analytics only. See our Terms.
Track these metrics on a free journal today
You do not need a spreadsheet full of formulas. You need trades imported, tags applied, and five numbers reviewed every week.
Create your free VeloTape account — no credit card required. Import your history, tag three setups, and open your dashboard metrics this session.
More guides

Free Trading Journal: The Complete Guide for 2026
Learn what to look for in a free trading journal, how to start in 10 minutes, and when a dedicated app beats spreadsheets — no credit card required.

How to Keep a Trading Journal: A Step-by-Step System That Sticks
Learn what to log after every trade, build a daily and weekly review routine, and use a simple template so your trading journal actually improves performance.

Trading Journal for Prop Firm Traders: Rules, Metrics & Challenge Workflow
Track daily loss limits, max drawdown, and challenge progress with Prop Desk on Free — plus CSV import and Apex/Tradovate sync on Essential.
Trading involves substantial risk. VeloTape is for journaling and analytics only — not investment advice.